ELK Stack Post — 1
Deploying ELK Stack for Apache Logs Analysis
In today’s world log analysis plays an important role. ELK Stack comes to rescue for this requirement. ELK is a popular log/data analysis open source platform. ELK stack has three main components:

Elasticsearch is the distributed search and analytics engine at the heart of the Elastic Stack.
Logstash and Beats facilitate collecting, aggregating, and enriching your data and storing it in Elasticsearch.
Kibana enables you to interactively explore, visualize, and share insights into your data and manage and monitor the stack.
In this blogpost, our goal is to build ELK stack server in most possible simple way and analyze Apache Web Server logs.
Please note: When installing the Elastic Stack, you must use the same version across the entire stack. We are using 7.3.1 here. In this setup we are sending data directly to Elasticsearch without logstash, which is not a recommended approach. It can create inconsistency.
What do we need for this: A fair capacity server with Apache, Open-Jdk installed.
Elasticsearch Setup
# sudo mkdir /elk
# sudo wget https://artifacts.elastic.co/downloads/elasticsearch/elasticsearch-7.3.1-linux-x86_64.tar.gz
# sudo tar -xzf elasticsearch-7.3.1-linux-x86_64.tar.gz
# cd /elk/elasticsearch-7.3.1/
Elasticsearch provides 3 files for configurational changes.
elasticsearch.yml for configuring Elasticsearchjvm.options for configuring Elasticsearch JVM settingslog4j2.properties for configuring Elasticsearch logging
Update the ELK config file for this deployment.
# vi /elk/elasticsearch-7.3.1/config/elasticsearch.yml
network.host: 0.0.0.0
discovery.seed_hosts: ["127.0.0.1", "[::1]"]
cluster.initial_master_nodes: ["elkstack"]
Update the system settings to keep Elasticsearch happy.
# sudo vi /etc/sysctl.conf
vm.max_map_count=262144
fs.file-max = 10000# sudo vi /etc/security/limits.conf
ubuntu    soft  nofile  6000
ubuntu    hard  nofile  65536
Start the services
# cd /elk/elasticsearch-7.3.1/bin
# sh elasticsearch
# sysctl -p
Access the service on
curl http://localhost:9200/Kibana Setup
Download it and unzip:
# wget https://artifacts.elastic.co/downloads/kibana/kibana-7.3.1-linux-x86_64.tar.gz
# tar -xvzf kibana-7.3.1-linux-x86_64.tar.gz
Configure the config file:
# vi /elk/kibana-7.3.1-linux-x86_64/config/kibana.yml
server.host: "0.0.0.0"
elasticsearch.hosts: ["http://localhost:9200"]
Now Access the Kibana URL on:- http://<servername>:5601/

To proceed further we need Apache Setup as well. Please update apache config file to capture trace data in logs. Following setting will force Apache to log client IP addresses.
# In /etc/apache2/apache2.conf
LogFormat "%h %l %u %t \"%r\" %>s %O \"%{Referer}i\" \"%{User-Agent}i\" %{ms}T %p %{Host}i" vhost_combined
Apart from this I have generated random load to generate access logs for analysis, using curl script and multiple browsers. We will see this data in Kibana.
FileBeat
Beats are lightweight agents that are installed on client hosts to collect different types of data for forwarding into the stack. We are using Filebeat in this scenario.
# curl -L -O https://artifacts.elastic.co/downloads/beats/filebeat/filebeat-7.3.1-linux-x86_64.tar.gz
# tar xzvf filebeat-7.3.1-linux-x86_64.tar.gz
# cd filebeat-7.3.1-linux-x86_64/
Update config file:
# validate file for Elasticsearch and Kibana
/elk/filebeat-7.3.1-linux-x86_64/filebeat.yml# Filebeat comes packaged with pre-built modules that contain the configurations needed to collect, parse, enrich, and visualize data from various log file formats. We will enable apache module for use.cd /elk
./filebeat modules enable apache# documentation: https://www.elastic.co/guide/en/beats/filebeat/current/filebeat-module-apache.html
Apache module and fileset has variables that you can set to change the default behavior of the module, including the paths where the module looks for log files. You can set the path in configuration or from the command line. For example:
/elk/filebeat-7.3.1-linux-x86_64/modules.d/apache.yml
cd /elk/filebeat-7.3.1-linux-x86_64
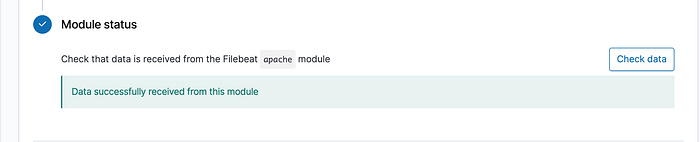
./filebeat setup
# run this to upload data
./filebeat -e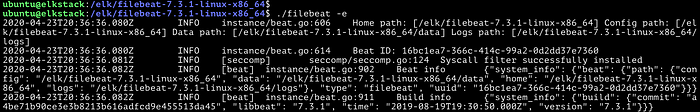
Check that data in received -
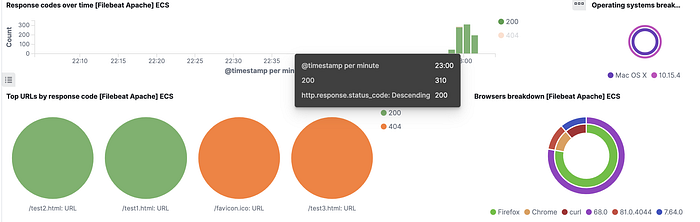
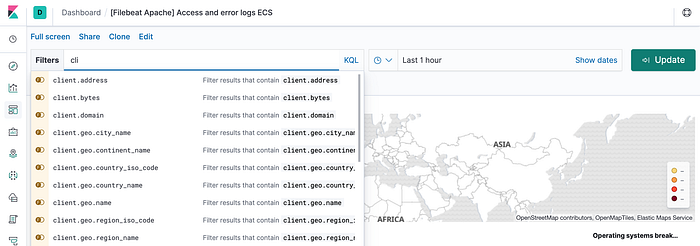
Now Lets go back to Kibana dashboard and search for apache.
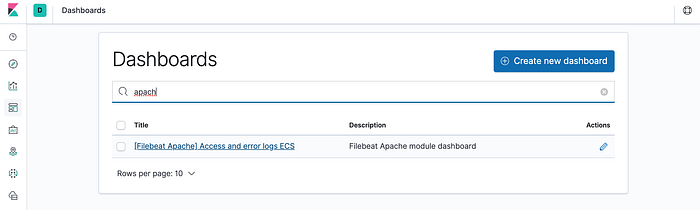
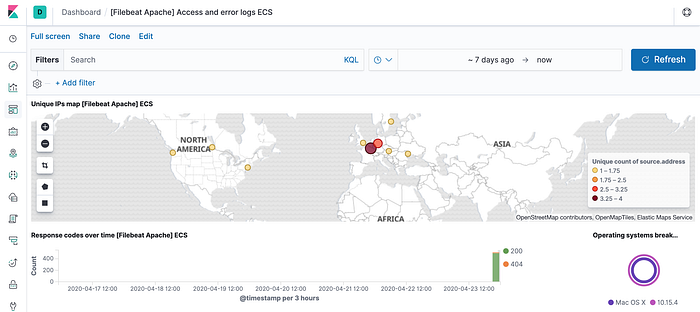
Voila ! You can see that it has visualize some important information by default.
Kibana can read Client IP data from logs and can create Geo-Heat Map instantly !
If you are done with the setup and practice, you can clear out data via curl.
# to delete all the indexes
curl -X DELETE 'http://localhost:9200/_all'# to check the stats
curl http://localhost:9200/_stats/# list all index:
curl -XGET http://localhost:9200/_cat/indices?v#delete index:
curl -XDELETE 'localhost:9200/index_name'#delete all indices:
curl -XDELETE 'localhost:9200/_all'#delete document
curl -XDELETE 'localhost:9200/index_name/type_name/document_id'
URL for post 2.
Happy Learning 😃!

